Working With Sessions
Import the LArray library:
[1]:
from larray import *
Before To Continue
If you are not yet comfortable with creating, saving and loading sessions, please read first the Creating Sessions section of the tutorial before going further.
Loading and Dumping Sessions
One of the main advantages of grouping arrays, axes and groups in session objects is that you can load and save all of them in one shot. Like arrays, it is possible to associate metadata to a session. These can be saved and loaded in all file formats.
Loading Sessions (CSV, Excel, HDF5)
To load the items of a session, you have two options:
- Instantiate a new session and pass the path to the Excel/HDF5 file or to the directory containing CSV files to the Session constructor:
[2]:
# create a new Session object and load all arrays, axes, groups and metadata
# from all CSV files located in the passed directory
csv_dir = get_example_filepath('demography_eurostat')
demography_session = Session(csv_dir)

# create a new Session object and load all arrays, axes, groups and metadata
# stored in the passed Excel file
filepath_excel = get_example_filepath('demography_eurostat.xlsx')
demography_session = Session(filepath_excel)

# create a new Session object and load all arrays, axes, groups and metadata
# stored in the passed HDF5 file
filepath_hdf = get_example_filepath('demography_eurostat.h5')
demography_session = Session(filepath_hdf)

print(demography_session.summary())
Metadata:
        title: Demographic datasets for a small selection of countries in Europe
        source: demo_jpan, demo_fasec, demo_magec and migr_imm1ctz tables from Eurostat
citizenship: citizenship ['Belgium' 'Luxembourg' 'Netherlands'] (3)
country: country ['Belgium' 'France' 'Germany'] (3)
country_benelux: country ['Belgium' 'Luxembourg' 'Netherlands'] (3)
gender: gender ['Male' 'Female'] (2)
time: time [2013 2014 2015 2016 2017] (5)
even_years: time[2014 2016] >> even_years (2)
odd_years: time[2013 2015 2017] >> odd_years (3)
births: country, gender, time (3 x 2 x 5) [int32]
deaths: country, gender, time (3 x 2 x 5) [int32]
immigration: country, citizenship, gender, time (3 x 3 x 2 x 5) [int32]
population: country, gender, time (3 x 2 x 5) [int32]
population_5_countries: country, gender, time (5 x 2 x 5) [int32]
population_benelux: country, gender, time (3 x 2 x 5) [int32]
- Call the
loadmethod on an existing session and pass the path to the Excel/HDF5 file or to the directory containing CSV files as first argument:
[3]:
# create a session containing 3 axes, 2 groups and one array 'population'
filepath = get_example_filepath('population_only.xlsx')
demography_session = Session(filepath)

print(demography_session.summary())
population: country, gender, time (3 x 2 x 3) [int64]
[4]:
# call the load method on the previous session and add the 'births' and 'deaths' arrays to it
filepath = get_example_filepath('births_and_deaths.xlsx')
demography_session.load(filepath)

print(demography_session.summary())
population: country, gender, time (3 x 2 x 3) [int64]
births: country, gender, time (3 x 2 x 3) [int64]
deaths: country, gender, time (3 x 2 x 3) [int64]
The load method offers some options:
- Using the
namesargument, you can specify which items to load:
[5]:
births_and_deaths_session = Session()

# use the names argument to only load births and deaths arrays
births_and_deaths_session.load(filepath_hdf, names=['births', 'deaths'])

print(births_and_deaths_session.summary())
Metadata:
        title: Demographic datasets for a small selection of countries in Europe
        source: demo_jpan, demo_fasec, demo_magec and migr_imm1ctz tables from Eurostat
births: country, gender, time (3 x 2 x 5) [int32]
deaths: country, gender, time (3 x 2 x 5) [int32]
- Setting the
displayargument to True, theloadmethod will print a message each time a new item is loaded:
[6]:
demography_session = Session()

# with display=True, the load method will print a message
# each time a new item is loaded
demography_session.load(filepath_hdf, display=True)
opening /home/docs/checkouts/readthedocs.org/user_builds/larray/envs/0.32.2/lib/python3.7/site-packages/larray/tests/data/demography_eurostat.h5
loading Axis object citizenship ... done
loading Axis object country ... done
loading Axis object country_benelux ... done
loading Axis object gender ... done
loading Axis object time ... done
loading Group object even_years ... done
loading Group object odd_years ... done
loading Array object births ... done
loading Array object deaths ... done
loading Array object immigration ... done
loading Array object population ... done
loading Array object population_5_countries ... done
loading Array object population_benelux ... done
Dumping Sessions (CSV, Excel, HDF5)
To save a session, you need to call the save method. The first argument is the path to a Excel/HDF5 file or to a directory if items are saved to CSV files:
[7]:
# save items of a session in CSV files.
# Here, the save method will create a 'demography' directory in which CSV files will be written
demography_session.save('demography')

# save the session to an HDF5 file
demography_session.save('demography.h5')

# save the session to an Excel file
demography_session.save('demography.xlsx')

# load session saved in 'demography.h5' to see its content
Session('demography.h5')
[7]:
Session(citizenship, country, country_benelux, gender, time, even_years, odd_years, births, deaths, immigration, population, population_5_countries, population_benelux)
__metadata__(.csv). This sheet (CSV file) name cannot be changed.The save method has several arguments:
- Using the
namesargument, you can specify which items to save:
[8]:
# use the names argument to only save births and deaths arrays
demography_session.save('demography.h5', names=['births', 'deaths'])

# load session saved in 'demography.h5' to see its content
Session('demography.h5')
[8]:
Session(births, deaths)
- By default, dumping a session to an Excel or HDF5 file will overwrite it. By setting the
overwriteargument to False, you can choose to update the existing Excel or HDF5 file:
[9]:
population = read_csv('./demography/population.csv')
population_session = Session([('population', population)])

# by setting overwrite to False, the destination file is updated instead of overwritten.
# The items already stored in the file but not present in the session are left intact.
# On the contrary, the items that exist in both the file and the session are completely overwritten.
population_session.save('demography.h5', overwrite=False)

# load session saved in 'demography.h5' to see its content
Session('demography.h5')
[9]:
Session(births, deaths, population)
- Setting the
displayargument to True, thesavemethod will print a message each time an item is dumped:
[10]:
# with display=True, the save method will print a message
# each time an item is dumped
demography_session.save('demography.h5', display=True)
dumping citizenship ... done
dumping country ... done
dumping country_benelux ... done
dumping gender ... done
dumping time ... done
dumping even_years ... done
dumping odd_years ... done
dumping births ... done
dumping deaths ... done
dumping immigration ... done
dumping population ... done
dumping population_5_countries ... done
dumping population_benelux ... done
Exploring Content
To get the list of items names of a session, use the names shortcut (be careful that the list is sorted alphabetically and does not follow the internal order!):
[11]:
# load a session representing the results of a demographic model
filepath_hdf = get_example_filepath('demography_eurostat.h5')
demography_session = Session(filepath_hdf)

# print the content of the session
print(demography_session.names)
['births', 'citizenship', 'country', 'country_benelux', 'deaths', 'even_years', 'gender', 'immigration', 'odd_years', 'population', 'population_5_countries', 'population_benelux', 'time']
To get more information of items of a session, the summary will provide not only the names of items but also the list of labels in the case of axes or groups and the list of axes, the shape and the dtype in the case of arrays:
[12]:
# print the content of the session
print(demography_session.summary())
Metadata:
        title: Demographic datasets for a small selection of countries in Europe
        source: demo_jpan, demo_fasec, demo_magec and migr_imm1ctz tables from Eurostat
citizenship: citizenship ['Belgium' 'Luxembourg' 'Netherlands'] (3)
country: country ['Belgium' 'France' 'Germany'] (3)
country_benelux: country ['Belgium' 'Luxembourg' 'Netherlands'] (3)
gender: gender ['Male' 'Female'] (2)
time: time [2013 2014 2015 2016 2017] (5)
even_years: time[2014 2016] >> even_years (2)
odd_years: time[2013 2015 2017] >> odd_years (3)
births: country, gender, time (3 x 2 x 5) [int32]
deaths: country, gender, time (3 x 2 x 5) [int32]
immigration: country, citizenship, gender, time (3 x 3 x 2 x 5) [int32]
population: country, gender, time (3 x 2 x 5) [int32]
population_5_countries: country, gender, time (5 x 2 x 5) [int32]
population_benelux: country, gender, time (3 x 2 x 5) [int32]
Selecting And Filtering Items
Session objects work like ordinary dict Python objects. To select an item, use the usual syntax <session_var>['<item_name>']:
[13]:
demography_session['population']
[13]:
country  gender\time      2013      2014      2015      2016      2017
Belgium         Male   5472856   5493792   5524068   5569264   5589272
Belgium       Female   5665118   5687048   5713206   5741853   5762455
 France         Male  31772665  32045129  32174258  32247386  32318973
 France       Female  33827685  34120851  34283895  34391005  34485148
Germany         Male  39380976  39556923  39835457  40514123  40697118
Germany       Female  41142770  41210540  41362080  41661561  41824535
A simpler way consists in the use the syntax <session_var>.<item_name>:
[14]:
demography_session.population
[14]:
country  gender\time      2013      2014      2015      2016      2017
Belgium         Male   5472856   5493792   5524068   5569264   5589272
Belgium       Female   5665118   5687048   5713206   5741853   5762455
 France         Male  31772665  32045129  32174258  32247386  32318973
 France       Female  33827685  34120851  34283895  34391005  34485148
Germany         Male  39380976  39556923  39835457  40514123  40697118
Germany       Female  41142770  41210540  41362080  41661561  41824535
**Warning:** The syntax ``session_var.item_name`` will work as long as you don't use any special character like ``, ; :`` in the item's name.
To return a new session with selected items, use the syntax <session_var>[list, of, item, names]:
[15]:
demography_session_new = demography_session['population', 'births', 'deaths']

demography_session_new.names
[15]:
['births', 'deaths', 'population']
The filter method allows you to select all items of the same kind (i.e. all axes, or groups or arrays) or all items with names satisfying a given pattern:
[16]:
# select only arrays of a session
demography_session.filter(kind=Array)
[16]:
Session(births, deaths, immigration, population, population_5_countries, population_benelux)
[17]:
# selection all items with a name starting with a letter between a and k
demography_session.filter(pattern='[a-k]*')
[17]:
Session(citizenship, country, country_benelux, gender, even_years, births, deaths, immigration)
Iterating over Items
Like the built-in Python dict objects, Session objects provide methods to iterate over items:
[18]:
# iterate over item names
for key in demography_session.keys():
    print(key)
citizenship
country
country_benelux
gender
time
even_years
odd_years
births
deaths
immigration
population
population_5_countries
population_benelux
[19]:
# iterate over items
for value in demography_session.values():
    if isinstance(value, Array):
        print(value.info)
    else:
        print(repr(value))
    print()
Axis(['Belgium', 'Luxembourg', 'Netherlands'], 'citizenship')

Axis(['Belgium', 'France', 'Germany'], 'country')

Axis(['Belgium', 'Luxembourg', 'Netherlands'], 'country')

Axis(['Male', 'Female'], 'gender')

Axis([2013, 2014, 2015, 2016, 2017], 'time')

time[2014, 2016] >> 'even_years'

time[2013, 2015, 2017] >> 'odd_years'

title: Live births by mother's age and newborn's sex
source: table demo_fasec from Eurostat
3 x 2 x 5
 country [3]: 'Belgium' 'France' 'Germany'
 gender [2]: 'Male' 'Female'
 time [5]: 2013 2014 2015 2016 2017
dtype: int32
memory used: 120 bytes

title: Deaths by age and sex
source: table demo_magec from Eurostat
3 x 2 x 5
 country [3]: 'Belgium' 'France' 'Germany'
 gender [2]: 'Male' 'Female'
 time [5]: 2013 2014 2015 2016 2017
dtype: int32
memory used: 120 bytes

title: Immigration by age group, sex and citizenship
source: table migr_imm1ctz from Eurostat
3 x 3 x 2 x 5
 country [3]: 'Belgium' 'Luxembourg' 'Netherlands'
 citizenship [3]: 'Belgium' 'Luxembourg' 'Netherlands'
 gender [2]: 'Male' 'Female'
 time [5]: 2013 2014 2015 2016 2017
dtype: int32
memory used: 360 bytes

title: Population on 1 January by age and sex
source: table demo_pjan from Eurostat
3 x 2 x 5
 country [3]: 'Belgium' 'France' 'Germany'
 gender [2]: 'Male' 'Female'
 time [5]: 2013 2014 2015 2016 2017
dtype: int32
memory used: 120 bytes

title: Population on 1 January by age and sex (Benelux + France + Germany)
source: table demo_pjan from Eurostat
5 x 2 x 5
 country [5]: 'Belgium' 'France' 'Germany' 'Luxembourg' 'Netherlands'
 gender [2]: 'Male' 'Female'
 time [5]: 2013 2014 2015 2016 2017
dtype: int32
memory used: 200 bytes

title: Population on 1 January by age and sex (Benelux)
source: table demo_pjan from Eurostat
3 x 2 x 5
 country [3]: 'Belgium' 'Luxembourg' 'Netherlands'
 gender [2]: 'Male' 'Female'
 time [5]: 2013 2014 2015 2016 2017
dtype: int32
memory used: 120 bytes
[20]:
# iterate over names and items
for key, value in demography_session.items():
    if isinstance(value, Array):
        print(key, ':')
        print(value.info)
    else:
        print(key, ':', repr(value))
    print()
citizenship : Axis(['Belgium', 'Luxembourg', 'Netherlands'], 'citizenship')

country : Axis(['Belgium', 'France', 'Germany'], 'country')

country_benelux : Axis(['Belgium', 'Luxembourg', 'Netherlands'], 'country')

gender : Axis(['Male', 'Female'], 'gender')

time : Axis([2013, 2014, 2015, 2016, 2017], 'time')

even_years : time[2014, 2016] >> 'even_years'

odd_years : time[2013, 2015, 2017] >> 'odd_years'

births :
title: Live births by mother's age and newborn's sex
source: table demo_fasec from Eurostat
3 x 2 x 5
 country [3]: 'Belgium' 'France' 'Germany'
 gender [2]: 'Male' 'Female'
 time [5]: 2013 2014 2015 2016 2017
dtype: int32
memory used: 120 bytes

deaths :
title: Deaths by age and sex
source: table demo_magec from Eurostat
3 x 2 x 5
 country [3]: 'Belgium' 'France' 'Germany'
 gender [2]: 'Male' 'Female'
 time [5]: 2013 2014 2015 2016 2017
dtype: int32
memory used: 120 bytes

immigration :
title: Immigration by age group, sex and citizenship
source: table migr_imm1ctz from Eurostat
3 x 3 x 2 x 5
 country [3]: 'Belgium' 'Luxembourg' 'Netherlands'
 citizenship [3]: 'Belgium' 'Luxembourg' 'Netherlands'
 gender [2]: 'Male' 'Female'
 time [5]: 2013 2014 2015 2016 2017
dtype: int32
memory used: 360 bytes

population :
title: Population on 1 January by age and sex
source: table demo_pjan from Eurostat
3 x 2 x 5
 country [3]: 'Belgium' 'France' 'Germany'
 gender [2]: 'Male' 'Female'
 time [5]: 2013 2014 2015 2016 2017
dtype: int32
memory used: 120 bytes

population_5_countries :
title: Population on 1 January by age and sex (Benelux + France + Germany)
source: table demo_pjan from Eurostat
5 x 2 x 5
 country [5]: 'Belgium' 'France' 'Germany' 'Luxembourg' 'Netherlands'
 gender [2]: 'Male' 'Female'
 time [5]: 2013 2014 2015 2016 2017
dtype: int32
memory used: 200 bytes

population_benelux :
title: Population on 1 January by age and sex (Benelux)
source: table demo_pjan from Eurostat
3 x 2 x 5
 country [3]: 'Belgium' 'Luxembourg' 'Netherlands'
 gender [2]: 'Male' 'Female'
 time [5]: 2013 2014 2015 2016 2017
dtype: int32
memory used: 120 bytes
Arithmetic Operations On Sessions
Session objects accept binary operations with a scalar:
[21]:
# get population, births and deaths in millions
demography_session_div = demography_session / 1e6

demography_session_div.population
[21]:
country  gender\time       2013       2014       2015       2016       2017
Belgium         Male   5.472856   5.493792   5.524068   5.569264   5.589272
Belgium       Female   5.665118   5.687048   5.713206   5.741853   5.762455
 France         Male  31.772665  32.045129  32.174258  32.247386  32.318973
 France       Female  33.827685  34.120851  34.283895  34.391005  34.485148
Germany         Male  39.380976  39.556923  39.835457  40.514123  40.697118
Germany       Female   41.14277   41.21054   41.36208  41.661561  41.824535
with an array (please read the documentation of the random.choice function first if you don’t know it):
[22]:
from larray import random
random_increment = random.choice([-1, 0, 1], p=[0.3, 0.4, 0.3], axes=demography_session.population.axes) * 1000
random_increment
[22]:
country  gender\time   2013   2014   2015   2016   2017
Belgium         Male      0      0      0      0      0
Belgium       Female   1000  -1000      0  -1000  -1000
 France         Male      0      0  -1000  -1000   1000
 France       Female   1000      0      0   1000      0
Germany         Male      0      0      0      0      0
Germany       Female  -1000      0      0      0  -1000
[23]:
# add some variables of a session by a common array
demography_session_rand = demography_session['population', 'births', 'deaths'] + random_increment

demography_session_rand.population
[23]:
country  gender\time      2013      2014      2015      2016      2017
Belgium         Male   5472856   5493792   5524068   5569264   5589272
Belgium       Female   5666118   5686048   5713206   5740853   5761455
 France         Male  31772665  32045129  32173258  32246386  32319973
 France       Female  33828685  34120851  34283895  34392005  34485148
Germany         Male  39380976  39556923  39835457  40514123  40697118
Germany       Female  41141770  41210540  41362080  41661561  41823535
with another session:
[24]:
# compute the difference between each array of the two sessions
s_diff = demography_session - demography_session_rand

s_diff.births
[24]:
country  gender\time   2013  2014  2015   2016   2017
Belgium         Male      0     0     0      0      0
Belgium       Female  -1000  1000     0   1000   1000
 France         Male      0     0  1000   1000  -1000
 France       Female  -1000     0     0  -1000      0
Germany         Male      0     0     0      0      0
Germany       Female   1000     0     0      0   1000
Applying Functions On All Arrays
In addition to the classical arithmetic operations, the apply method can be used to apply the same function on all arrays. This function should take a single element argument and return a single value:
[25]:
# add the next year to all arrays
def add_next_year(array):
    if 'time' in array.axes.names:
        last_year = array.time.i[-1]
        return array.append('time', 0, last_year + 1)
    else:
        return array

demography_session_with_next_year = demography_session.apply(add_next_year)

print('population array before calling apply:')
print(demography_session.population)
print()
print('population array after calling apply:')
print(demography_session_with_next_year.population)
population array before calling apply:
country  gender\time      2013      2014      2015      2016      2017
Belgium         Male   5472856   5493792   5524068   5569264   5589272
Belgium       Female   5665118   5687048   5713206   5741853   5762455
 France         Male  31772665  32045129  32174258  32247386  32318973
 France       Female  33827685  34120851  34283895  34391005  34485148
Germany         Male  39380976  39556923  39835457  40514123  40697118
Germany       Female  41142770  41210540  41362080  41661561  41824535

population array after calling apply:
country  gender\time      2013      2014      2015      2016      2017  2018
Belgium         Male   5472856   5493792   5524068   5569264   5589272     0
Belgium       Female   5665118   5687048   5713206   5741853   5762455     0
 France         Male  31772665  32045129  32174258  32247386  32318973     0
 France       Female  33827685  34120851  34283895  34391005  34485148     0
Germany         Male  39380976  39556923  39835457  40514123  40697118     0
Germany       Female  41142770  41210540  41362080  41661561  41824535     0
It is possible to pass a function with additional arguments:
[26]:
# add the next year to all arrays.
# Use the 'copy_values_from_last_year flag' to indicate
# whether or not to copy values from the last year
def add_next_year(array, copy_values_from_last_year):
    if 'time' in array.axes.names:
        last_year = array.time.i[-1]
        value = array[last_year] if copy_values_from_last_year else 0
        return array.append('time', value, last_year + 1)
    else:
        return array

demography_session_with_next_year = demography_session.apply(add_next_year, True)

print('population array before calling apply:')
print(demography_session.population)
print()
print('population array after calling apply:')
print(demography_session_with_next_year.population)
population array before calling apply:
country  gender\time      2013      2014      2015      2016      2017
Belgium         Male   5472856   5493792   5524068   5569264   5589272
Belgium       Female   5665118   5687048   5713206   5741853   5762455
 France         Male  31772665  32045129  32174258  32247386  32318973
 France       Female  33827685  34120851  34283895  34391005  34485148
Germany         Male  39380976  39556923  39835457  40514123  40697118
Germany       Female  41142770  41210540  41362080  41661561  41824535

population array after calling apply:
country  gender\time      2013      2014      2015      2016      2017      2018
Belgium         Male   5472856   5493792   5524068   5569264   5589272   5589272
Belgium       Female   5665118   5687048   5713206   5741853   5762455   5762455
 France         Male  31772665  32045129  32174258  32247386  32318973  32318973
 France       Female  33827685  34120851  34283895  34391005  34485148  34485148
Germany         Male  39380976  39556923  39835457  40514123  40697118  40697118
Germany       Female  41142770  41210540  41362080  41661561  41824535  41824535
It is also possible to apply a function on non-Array objects of a session. Please refer the documentation of the apply method.
Comparing Sessions
Being able to compare two sessions may be useful when you want to compare two different models expected to give the same results or when you have updated your model and want to see what are the consequences of the recent changes.
Session objects provide the two methods to compare two sessions: equals and element_equals:
- The
equalsmethod will return True if all items from both sessions are identical, False otherwise. - The
element_equalsmethod will compare items of two sessions one by one and return an array of boolean values.
[27]:
# load a session representing the results of a demographic model
filepath_hdf = get_example_filepath('demography_eurostat.h5')
demography_session = Session(filepath_hdf)

# create a copy of the original session
demography_session_copy = demography_session.copy()
[28]:
# 'element_equals' compare arrays one by one
demography_session.element_equals(demography_session_copy)
[28]:
name  citizenship  ...  population_5_countries  population_benelux
             True  ...                    True                True
[29]:
# 'equals' returns True if all items of the two sessions have exactly the same items
demography_session.equals(demography_session_copy)
[29]:
True
[30]:
# slightly modify the 'population' array for some labels combination
demography_session_copy.population += random_increment
[31]:
# the 'population' array is different between the two sessions
demography_session.element_equals(demography_session_copy)
[31]:
name  citizenship  ...  population_5_countries  population_benelux
             True  ...                    True                True
[32]:
# 'equals' returns False if at least one item of the two sessions are different in values or axes
demography_session.equals(demography_session_copy)
[32]:
False
[33]:
# reset the 'copy' session as a copy of the original session
demography_session_copy = demography_session.copy()

# add an array to the 'copy' session
demography_session_copy.gender_ratio = demography_session_copy.population.ratio('gender')
[34]:
# the 'gender_ratio' array is not present in the original session
demography_session.element_equals(demography_session_copy)
[34]:
name  citizenship  ...  population_benelux  gender_ratio
             True  ...                True         False
[35]:
# 'equals' returns False if at least one item is not present in the two sessions
demography_session.equals(demography_session_copy)
[35]:
False
The == operator return a new session with boolean arrays with elements compared element-wise:
[36]:
# reset the 'copy' session as a copy of the original session
demography_session_copy = demography_session.copy()

# slightly modify the 'population' array for some labels combination
demography_session_copy.population += random_increment
[37]:
s_check_same_values = demography_session == demography_session_copy

s_check_same_values.population
[37]:
country  gender\time   2013   2014   2015   2016   2017
Belgium         Male   True   True   True   True   True
Belgium       Female  False  False   True  False  False
 France         Male   True   True  False  False  False
 France       Female  False   True   True  False   True
Germany         Male   True   True   True   True   True
Germany       Female  False   True   True   True  False
This also works for axes and groups:
[38]:
s_check_same_values.time
[38]:
time  2013  2014  2015  2016  2017
      True  True  True  True  True
The != operator does the opposite of == operator:
[39]:
s_check_different_values = demography_session != demography_session_copy

s_check_different_values.population
[39]:
country  gender\time   2013   2014   2015   2016   2017
Belgium         Male  False  False  False  False  False
Belgium       Female   True   True  False   True   True
 France         Male  False  False   True   True   True
 France       Female   True  False  False   True  False
Germany         Male  False  False  False  False  False
Germany       Female   True  False  False  False   True
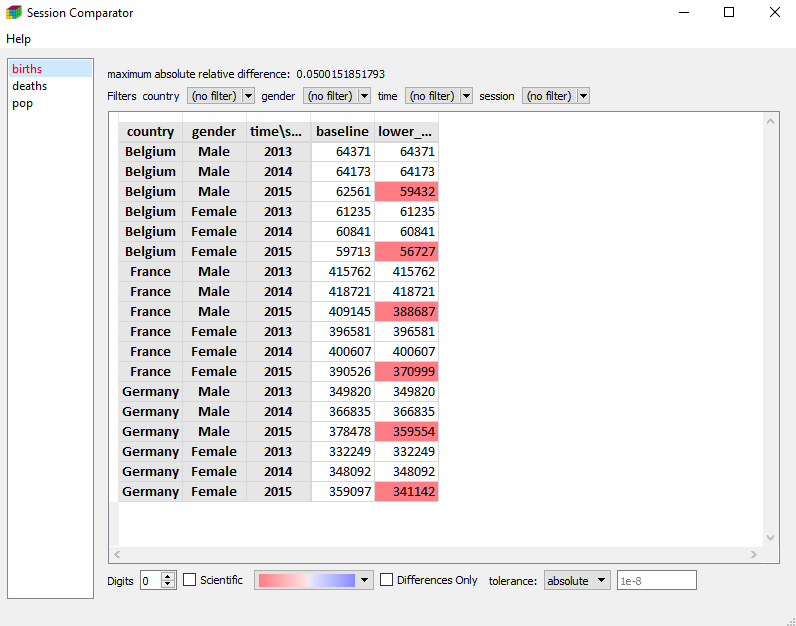
A more visual way is to use the compare function which will open the Editor.
compare(demography_session, demography_session_alternative, names=['baseline', 'lower_birth_rate'])